Advanced Crypto Trading & Analysis
📚 Introduction
Learn how to go beyond basics with trading strategies, indicators, and managing risk. This guide helps you understand what seasoned traders watch daily.
Crypto trading goes far beyond buying and holding. Serious traders use leverage, technical indicators, risk strategies, and deep market knowledge. This guide will walk you through the core tools that pros use, so you can learn safely and build skills step by step.💥 Leverage Trading
Leverage lets you control bigger positions with smaller capital. It magnifies gains AND losses. Always use stop-losses and never over-leverage.
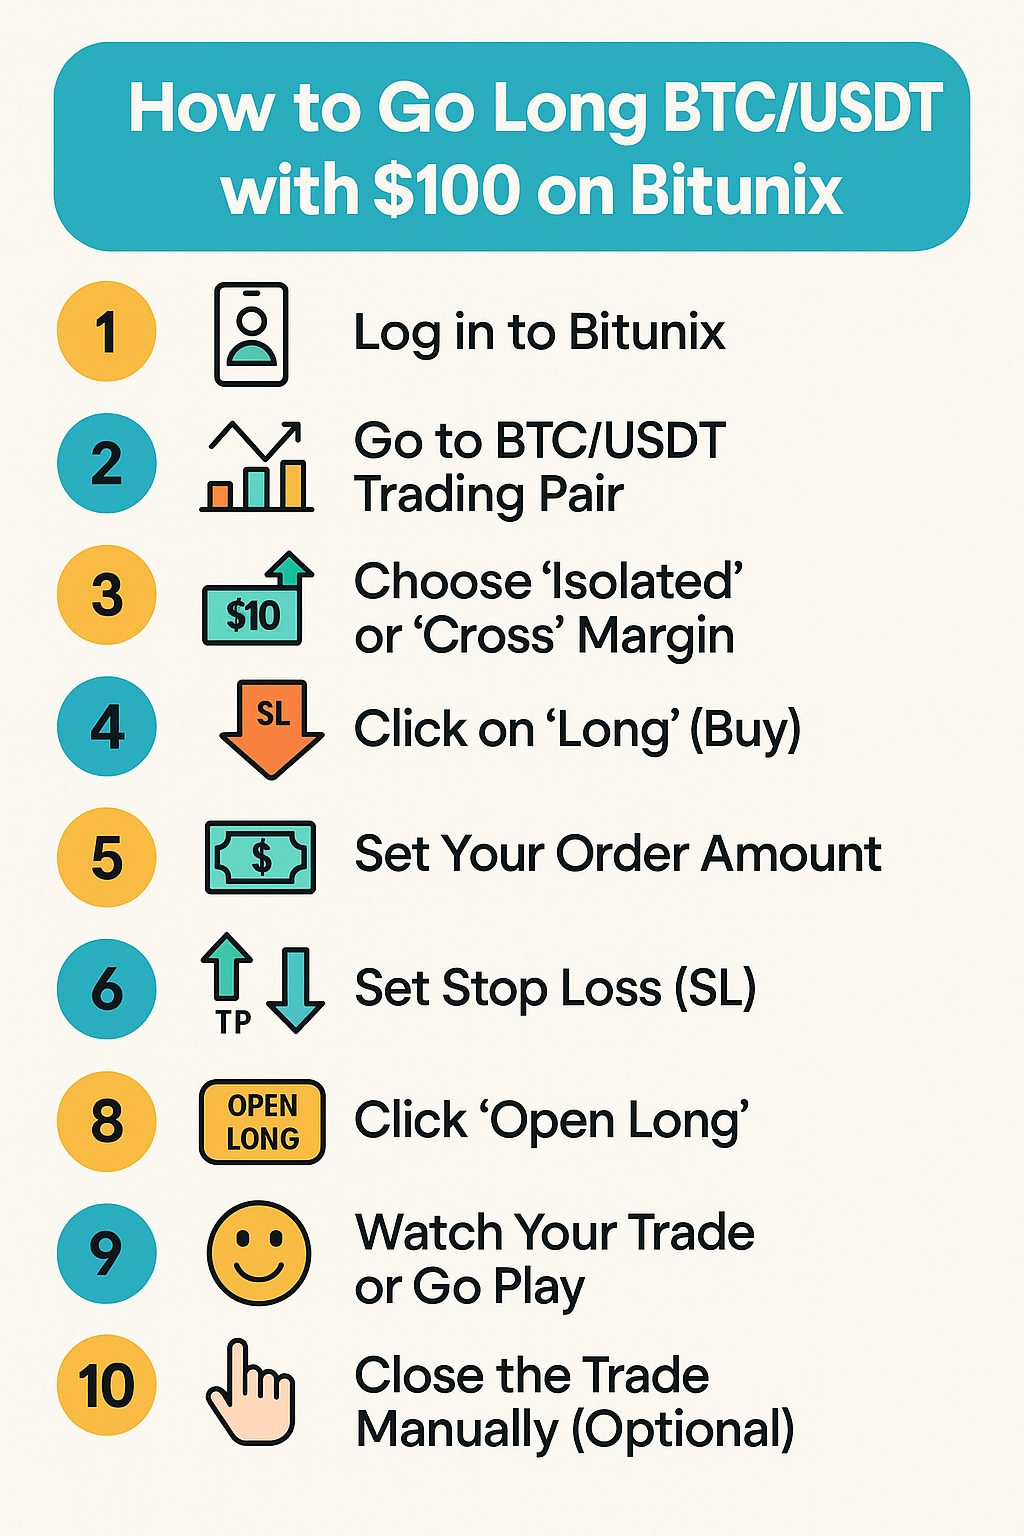
What is Leverage? Leverage lets you trade with borrowed funds e.g. 10x leverage means you control $1,000 with just $100. Profits grow faster, but losses can wipe your balance instantly if you don't manage risk. How it works: - Isolated vs. Cross Margin: Isolated limits losses to one position. Cross shares margin across positions. Example: With $100 at 5x leverage, a 10% price move = 50% gain or loss. Tip: Use low leverage (1–3x) while learning. Must Use: ✅ Stop-loss orders ✅ Clear entry and exit plans ✅ Small position sizes🧩 Orders & Execution
Market, limit, stop-loss — know how to use them. Example: Limit orders control your entry, stop-loss protects you from big losses.
Order Types: Market Order: Buy/Sell instantly at best price. Good for speed. Limit Order: Buy/Sell at your set price or better. Good for control. Stop-Loss: Automatic sell to limit losses. Example: You want BTC at $30,000 but it's $30,500. Set a limit buy at $30,000 — it only executes if price drops.📈 Technical Analysis (TA)
TA helps you read charts: trends, support/resistance, candlestick patterns. Combining patterns improves accuracy.
TA uses price charts and volume to find patterns. Key tools: Trend Lines: Connect highs/lows to find uptrend or downtrend. Support & Resistance: Price zones where trends often pause or reverse. Candlestick Patterns: E.g. Doji (reversal), Engulfing (strong reversal). Example: If BTC breaks above resistance with strong volume → possible breakout. Tip: Combine multiple signals (trend, pattern, indicator) for stronger setups.📊 RSI
Relative Strength Index shows overbought/oversold levels. Example: RSI above 70 = possible sell zone, below 30 = possible buy zone.
RSI measures if an asset is overbought or oversold: Above 70: Could mean overbought → possible pullback. Below 30: Could mean oversold → possible bounce. Example: BTC RSI hits 75 on daily chart → traders watch for reversal signs. Pro tip: RSI works best with trend. In strong trends, RSI can stay high/low longer.📏 Bollinger Bands
Shows volatility. Price often bounces between bands. Tight bands mean low volatility — breakout likely soon.
Draw retracement levels to find possible bounce or reversal areas. Common levels: 38.2%, 50%, 61.8%.Bollinger Bands measure volatility. Middle line: Moving Average Upper & Lower Bands: 2 standard deviations above/below When bands squeeze: Low volatility → breakout likely soon. When price touches bands: Can signal reversal or continuation. Example: If BTC touches upper band with high volume → watch for breakout or reversal candles.🔢 Fibonacci
Fibonacci levels help find pullback zones in trends. Common levels: 38.2%, 50%, 61.8% Example: BTC rises $20,000 → $40,000. Retrace to 38.2% = ~$32,360 → possible support zone to buy. Tip: Combine Fib levels with support/resistance for strong setups.💰 DeFi & Staking
DeFi lets you earn yield by lending or staking crypto. Always check smart contract risks. Never stake all funds.
DeFi (Decentralized Finance): Lend, borrow, or earn yield directly on blockchain. Staking: Lock coins to earn rewards for securing networks (e.g., staking ETH). Risks: Smart contract hacks Impermanent loss in liquidity pools Tips: ✅ Research protocols ✅ Diversify, don't stake all ✅ Use reputable wallets🕵️♂️ Market Manipulation
Pumps, dumps, stop hunts — whales can move markets. Use tight risk management, avoid chasing hype.
Crypto is volatile. Watch for: Whale Moves: Big players can pump/dump prices. Fakeouts: Price briefly breaks a level, then reverses to trap traders. Stop Hunts: Price spikes to trigger stop-losses before real move. How to protect: ✅ Use tight risk management ✅ Don't chase pumps ✅ Watch order books, news, social hype🛡️ Risk Management
Protect your capital: use stop-losses, manage position size, never risk money you can't afford to lose.
Most new traders fail because they don't manage risk. Golden Rules: ✅ Never risk more than 1–2% of total capital per trade ✅ Use stop-loss every time ✅ Have a clear exit plan Example: - Account = $1,000 → Max loss per trade = $10–$20.1️⃣ Wedges
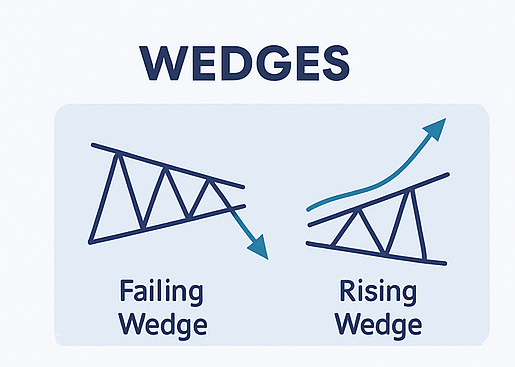
What It Is: A wedge is a narrowing price range, often sloping either up or down.
- Falling wedge → bullish reversal or continuation
- Rising wedge → bearish reversal or continuation
Key Points:
- Volume usually decreases during wedge formation
- Breakouts typically come with volume spike
- Best used with trend confirmation indicators
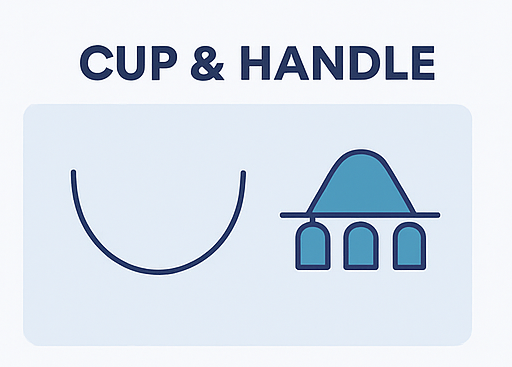
2️⃣ Cup and Handle
What It Is: A bullish continuation pattern. The "cup" forms a U-shape, and the "handle" is a small downward pullback before breakout.
Key Points:
- Volume decreases in the cup, then increases on breakout
- Handle should be smaller than the cup
- Ideal in strong uptrends
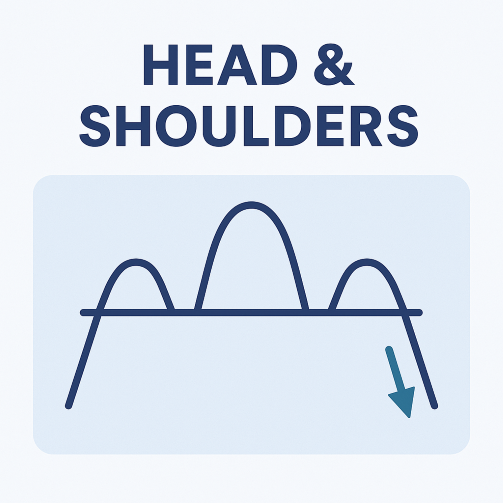
3️⃣ Head & Shoulders
What It Is: A reversal pattern. Regular signals top; inverse signals bottom.
- Three peaks: middle is the highest (head), sides are equal-ish (shoulders)
- The "neckline" is the key support/resistance line
- Breakout happens when neckline breaks with volume
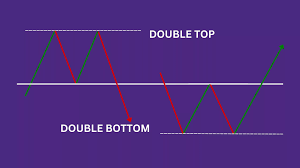
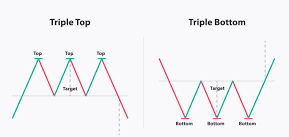
4️⃣ Double & Triple Tops & Bottoms
What It Is: Reversal patterns showing the price has hit a strong barrier multiple times and failed.
- Double top → bearish, looks like an "M"
- Double bottom → bullish, looks like a "W"
- Triple top/bottom → stronger confirmation than double
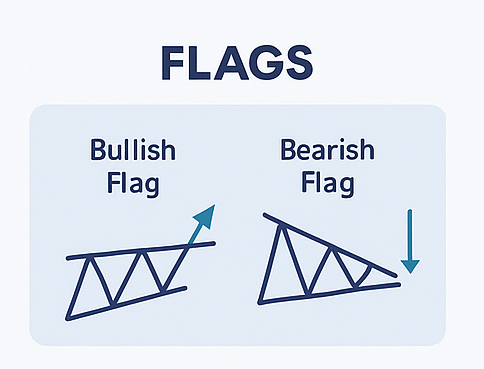
5️⃣ Flags
What It Is: Small rectangular consolidation patterns after a sharp move (flagpole).
- Bull flag: Uptrend → pause → breakout higher
- Bear flag: Downtrend → pause → breakdown lower
- Volume typically fades inside the flag, then spikes on breakout
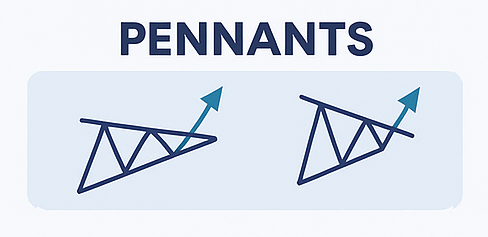
6️⃣ Pennants
What It Is: Similar to flags, but instead of a rectangle, it forms a small symmetrical triangle.
- Sharp move → tight consolidation → breakout in same direction
- Volume fades in the pennant
- Works well in fast-moving markets
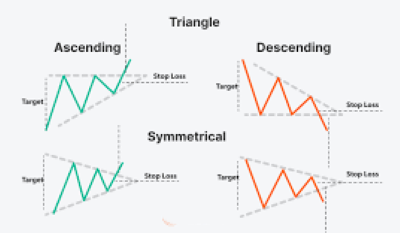
7️⃣ Triangles
What It Is: Common continuation patterns that show tightening price action.
- Ascending: flat resistance, rising support → bullish
- Descending: flat support, falling resistance → bearish
- Symmetrical: both lines converge → breakout can go either way
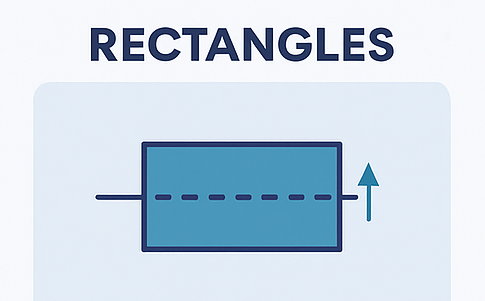
8️⃣ Rectangles
What It Is: A price range where the market moves sideways, bouncing between support and resistance.
- Breakout can be up or down
- Useful for setting stop-loss and entry orders
- Wait for a confirmed breakout before trading
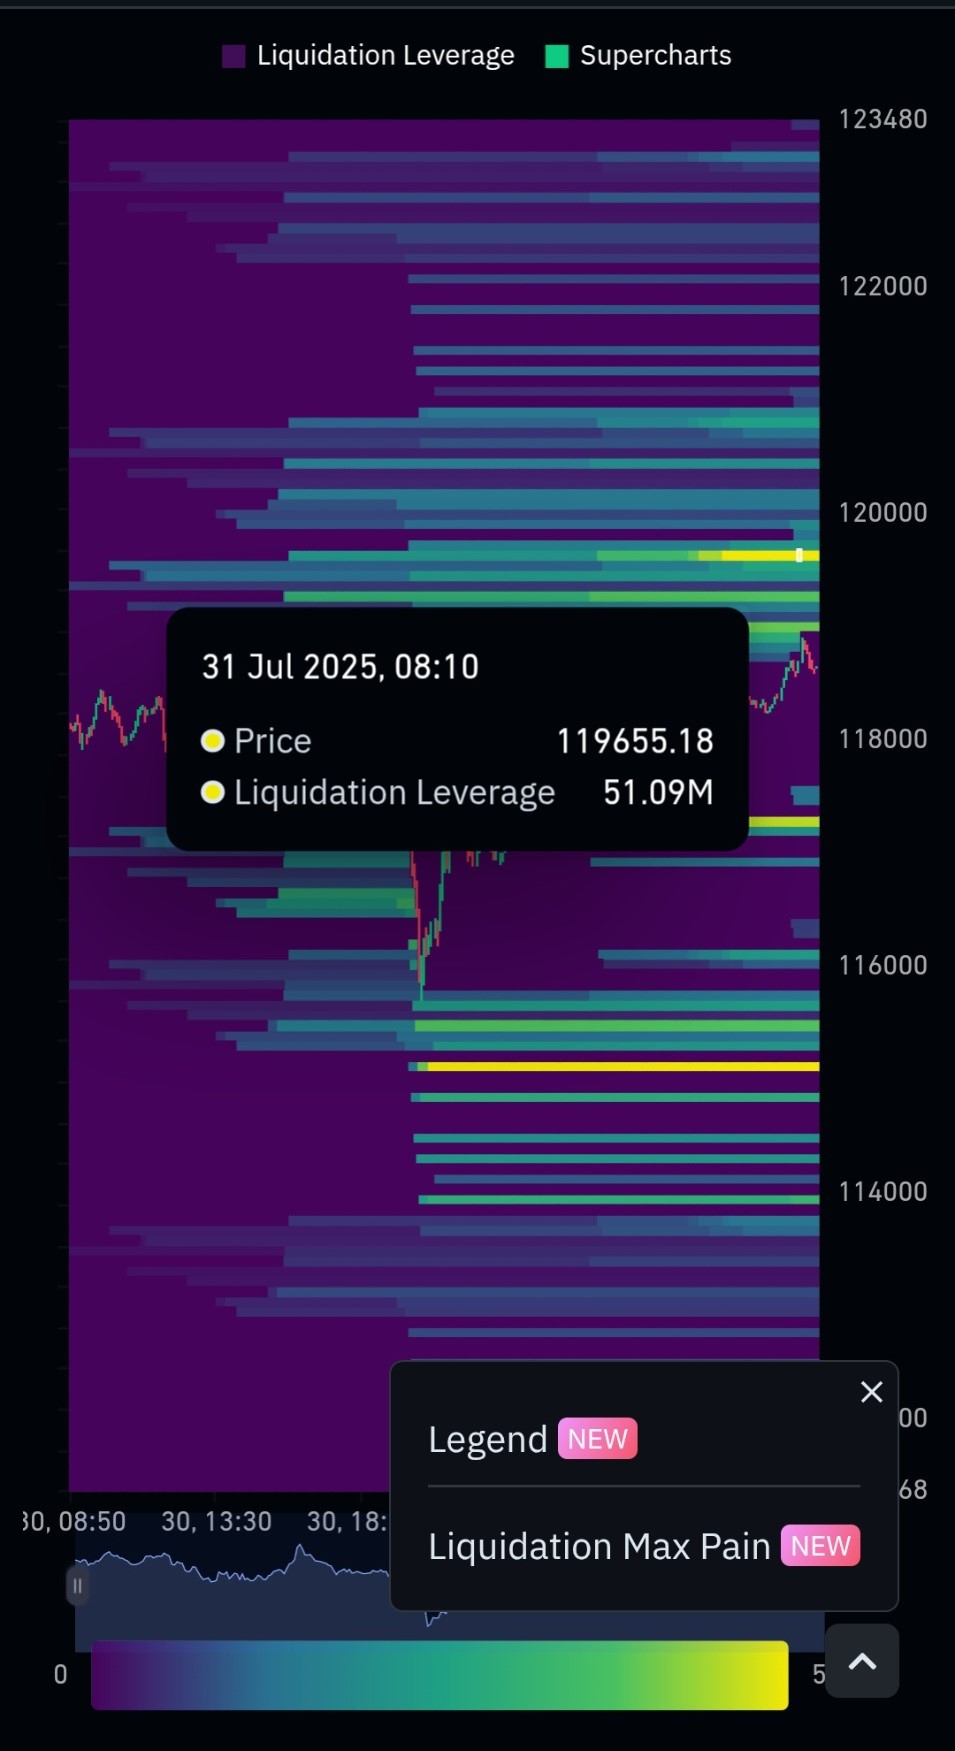
🚀 Bitcoin Liquidation Heatmap
🧠 What are Liquidations?Liquidations happen when traders borrow money (leverage) and the price moves against them too far. Longs get liquidated when the price drops. Shorts get liquidated when the price rises. 🧠 What you're looking at: This is a Bitcoin liquidation heatmap on CoinGlass. It shows where traders are likely to lose money (called liquidation) because they used leverage (borrowing money to trade bigger). 🟨 STEP-BY-STEP: What the chart is saying 🔢 1. What is "liquidation"? Imagine you're playing with your pocket money. You borrow extra from a friend to buy more candy. If the candy price drops too much, your friend says "You lost too much, game over!" That's liquidation. Same in crypto! If the price moves too far in the wrong direction, traders who borrowed money (used leverage) get liquidated they're forced to close their trade and lose money. 🟣 2. What do the colors mean? Purple background: This is just the heatmap canvas. Bright YELLOW or GREEN areas: These are liquidation zones where a lot of long or short trades might get liquidated. Bright = more danger Faded = less danger Yellow = BIG trouble zones (lots of people might lose money if the price hits there) 📈 3. What's going on in this image chart? 🕗 Time: 31 July 2025, 08:10am UK 💰 Price of Bitcoin: $119,655.18 💥 Liquidation Leverage: $51.09 million (that means lots of people could be liquidated here!) 🤔 4. Longs and Shorts—Who's at risk? 🔵 Longs = People betting price will go UP 🔴 Shorts = People betting price will go DOWN So: If the price goes down to a yellow area below — it will liquidate long traders. If the price goes up to a yellow area above — it will liquidate short traders. 🕹️ 5. How you can use this as a trader (even simply): ✅ If you see a big yellow zone above price → Many short traders might get liquidated if price pumps → Price might shoot up fast to "hunt them" ✅ If you see a big yellow zone below price → Many long traders might get liquidated if price drops → Price might dip fast to "hunt longs" 🧲 6. "Max Pain" zones These are where the most liquidations would happen if price hits there. Price sometimes moves toward these areas because big traders (whales) want to trigger liquidations and take money from small traders. 📌 Summary simple explaination: What it Means Yellow Bar - A lot of people could lose money there Bright Yellow - SUPER dangerous zone Price Going Up into Yellow - Shorts Ccould lose money Price Going Down into Yellow - Longs could lose money You? Watch those zones — price might rush there! |
|
🚀 Getting Started + Journal
📌 Start with a small account. Use a demo if unsure. Learn charting tools, practice placing orders. Join reliable communities — stay informed!
1️⃣ Practice: Use a demo or tiny real trades. 2️⃣ Learn daily: Follow charts, read news, test strategies. 3️⃣ Community: Join forums & groups for tips (but do your own research). Always remember: Start small, think big, grow smart.Download the journal to help get started